Complete Feature List
This document provides a comprehensive overview of all features in Rails Error Dashboard.
Feature Categories
Rails Error Dashboard uses an opt-in architecture with two categories of features:
Tier 1 Features (Always ON)
Core features that are always enabled - no configuration needed:
- ✅ Error Tracking & Capture - Automatic error logging from controllers, jobs, middleware
- ✅ Dashboard & UI - Modern interface with search, filtering, real-time updates
- ✅ Analytics & Insights - Trend charts, severity breakdown, spike detection
- ✅ Security & Privacy - HTTP Basic Auth or custom auth (Devise/Warden/lambda), data retention
Optional Features (Opt-in)
24+ features you can enable during installation or anytime in the initializer (plus separate database via the database mode selector):
📧 Notifications (5 features)
- Slack, Email, Discord, PagerDuty, Webhooks
⚡ Performance (3 features)
- Async Logging, Error Sampling, Separate Database
📊 Advanced Analytics (7 features)
- Baseline Alerts, Fuzzy Matching, Co-occurring Errors, Error Cascades, Correlation, Platform Comparison, Occurrence Patterns
🔍 Developer Tools (6 features)
- Source Code Integration, Git Blame, Breadcrumbs, System Health Snapshot, Job Health Page, Database Health Page
🔬 Deep Debugging (6 features) — v0.4.0
- Local Variable Capture, Instance Variable Capture, Swallowed Exception Detection, On-Demand Diagnostic Dump, Rack Attack Event Tracking, Process Crash Capture
🆕 v0.2 Smart Defaults (Always ON)
- Exception Cause Chains, Enriched Context, Environment Info, Structured Backtrace, Sensitive Data Filtering, Auto-Reopen, CurrentAttributes Integration, BRIN Indexes
🆕 v0.2 Configurable
- Custom Fingerprint Lambda, Notification Throttling (severity filter, cooldown, threshold alerts)
All optional features are disabled by default and can be toggled on/off at any time. See Configuration Guide for setup.
Error Tracking & Capture
Automatic Error Capture
- Rails Controllers - Catches all unhandled exceptions via Rails error reporting
- Background Jobs - ActiveJob, Sidekiq, Solid Queue, Delayed Job, Resque
- Rack Middleware - Catches any errors that slip through
- Manual Logging - API for logging custom errors from any source
Platform Detection
- Automatic platform identification from User-Agent headers
- Supports: iOS, Android, Web, API
- Custom platforms via manual specification
- Browser detection with device details (Chrome, Safari, Firefox, etc.)
Error Context
- Full backtrace with file paths, line numbers, and method names
- Numbered backtrace frames 🆕 — Each frame displays a numbered indicator for easy reference during debugging
- Structured backtrace 🆕 — Uses
backtrace_locationsfor richer path/line/method data when available - Request details: URL, HTTP method, params, headers
- Enriched HTTP context 🆕 —
http_method,hostname,content_type,request_duration_mscaptured automatically - Exception cause chain 🆕 — Full
causechain stored as structured JSON (e.g.,SocketError→RuntimeError) - Environment info 🆕 — Ruby version, Rails version, gem versions, server, database adapter captured at error time
- CurrentAttributes integration 🆕 — Auto-captures
Current.user,Current.account, and any otherActiveSupport::CurrentAttributes - User tracking: Associate errors with specific users
- Custom context: Add any metadata you need (component, screen, action, etc.)
- App version tracking: Git SHA and version number
- Stack traces for both Ruby and JavaScript errors
Dashboard & UI
Modern Interface
- Bootstrap 5 responsive design
- Dark/Light mode toggle with theme persistence
- Mobile-optimized layout for on-the-go debugging
- Clean, professional design you can show to clients
- Color-coded severity badges (Critical, High, Medium, Low)
- Status indicators (Resolved, Unresolved)
Real-Time Updates ⚡
- Live error list - New errors appear instantly at the top
- Auto-refreshing statistics - Dashboard cards update in real-time
- Visual notifications - Yellow highlight for new errors
- Pulsing animations on updated metrics
- Turbo Streams powered (WebSocket/SSE)
- Zero configuration - Works out of the box
- Low bandwidth - Only ~800 bytes per update
Search & Filtering
- Text search across error messages and types
- Filter by platform (iOS, Android, Web, API)
- Filter by severity (Critical, High, Medium, Low)
- Filter by status (Resolved, Unresolved, All)
- Date range filtering (Today, This Week, This Month, Custom)
- Combined filters for precise queries
Pagination
- Pagy-powered (40x faster than Kaminari)
- Configurable page size (25, 50, 100 errors)
- Jump to page functionality
- Responsive on mobile and desktop
Keyboard Shortcuts
- r - Refresh page
- / - Focus search
- a - Go to analytics
- s - Toggle sidebar
- ? - Show keyboard shortcuts help
Analytics & Insights
Error Trends
- 7-day trend chart showing daily error patterns
- Line chart visualization with interactive tooltips
- Trend indicators (up, down, stable)
- Pattern recognition to correlate with deployments
Severity Breakdown
- Donut chart showing distribution by severity
- Percentage breakdown (Critical, High, Medium, Low)
- Visual severity comparison at a glance
Spike Detection 🚨
- Automatic alerts when errors exceed 2x the 7-day average
- Smart severity levels:
- Elevated (2-5x baseline)
- High (5-10x baseline)
- Critical (>10x baseline)
- Contextual metrics showing today vs. average with multiplier
Platform Comparison
- Side-by-side metrics for iOS vs Android vs Web vs API
- Platform-specific error rates
- Cross-platform correlation analysis
- Platform health scores (0-100)
User Impact Analysis
- Percentage of users affected by each error type
- User correlation - Find users hit by multiple errors
- Impact score based on affected user count
Smart Priority Scoring
- 0-100 priority score for each error
- Based on: severity, frequency, recency, user impact
- Auto-sorting by priority to focus on critical issues first
Resolution Tracking
- Resolution rate percentage
- Average time to resolve
- Resolver tracking (who fixed what)
- Resolution comments with links to PRs/commits
Time-Series Analysis
- Hourly patterns - Identify when errors occur most
- Daily patterns - Spot trends over days
- Weekly patterns - See cyclical issues
- Custom date ranges (7, 14, 30, 90 days)
Notifications & Alerting
⚙️ Optional Features - All notification channels are disabled by default. Enable them during installation or in the initializer:
config.enable_slack_notifications = true
config.enable_email_notifications = true
config.enable_discord_notifications = true
config.enable_pagerduty_notifications = true
config.enable_webhook_notifications = true
Slack Integration
- Rich message formatting with markdown
- Color-coded attachments by severity (red, orange, yellow, blue)
- Error details including message, type, platform
- Direct links to full error in dashboard
- Backtrace preview (first 5 lines)
- User context (if available)
- Instant delivery via background jobs
Email Notifications
- HTML email templates (professional design)
- Plain text fallback
- Multiple recipients support
- Configurable sender address
- Full error context in email body
- Click to view in dashboard link
Discord Integration
- Rich embeds with color-coded severity
- Formatted messages with markdown
- Error metadata in embed fields
- Backtrace snippets
- Webhook-based (no bot required)
PagerDuty Integration
- Critical errors only (to avoid alert fatigue)
- Incident creation with full context
- On-call escalation for high-severity issues
- Integration via Events API
Custom Webhooks
- POST to any URL with error payload
- Multiple webhook URLs supported
- JSON payload with full error data
- Retry logic for failed webhooks
- Integrate with: Zapier, IFTTT, custom services
Notification Throttling 🆕
- Severity filter —
config.notification_minimum_severityskips notifications for low-priority errors - Per-error cooldown —
config.notification_cooldown_minutes(default: 5) prevents duplicate notifications for the same error - Threshold alerts —
config.notification_threshold_alerts(default:[10, 50, 100, 500, 1000]) sends milestone notifications when errors hit occurrence thresholds
config.notification_minimum_severity = :medium  # Skip :low severity
config.notification_cooldown_minutes = 10       # 10-minute cooldown per error
config.notification_threshold_alerts = [10, 50, 100, 500, 1000]  # Milestone alerts
Notification Callbacks
- Ruby code hooks for custom logic
- Event types: error_logged, critical_error, error_resolved
- Access to full error object
- Execute custom actions (create tickets, send metrics, etc.)
Performance & Scalability
⚙️ Optional Features - Performance optimizations are disabled by default. Enable as needed:
config.async_logging = true           # Async error logging
config.sampling_rate = 0.1            # Error sampling (10%)
config.use_separate_database = true   # Separate database
Async Error Logging
- Non-blocking error capture
- Background job processing via ActiveJob
- Supports:
- Sidekiq
- Solid Queue
- Async (Rails default)
- Delayed Job
- Resque
- Any ActiveJob adapter
- Dedicated queue (
:error_notifications) - Configurable on/off per environment
Backtrace Limiting
- 70-90% storage reduction with minimal information loss
- Configurable line limit (default: 100 lines)
- First N lines (most relevant for debugging)
- Reduces database size significantly for high-volume apps
Error Sampling
- Probabilistic sampling for non-critical errors
- 0.0 to 1.0 sampling rate (0 = none, 1.0 = all)
- Critical errors ALWAYS logged (SecurityError, NoMemoryError, etc.)
- Reduce volume in high-traffic apps while keeping important errors
Ignored Exceptions
- Skip logging known/expected errors
- Exact class name matching (
"ActionController::RoutingError") - Regex pattern matching (
/^ActiveRecord::RecordNotFound/) - Reduce noise from expected exceptions (404s, CSRF, etc.)
Database Optimization
- Composite indexes for 100-2500x query speedups
- BRIN indexes 🆕 — PostgreSQL BRIN index on
occurred_at(72KB vs 676MB B-tree) - Functional indexes 🆕 —
DATE(occurred_at)index for 70x faster time-group queries - Partial indexes for unresolved errors (PostgreSQL)
- GIN indexes for full-text search (PostgreSQL)
- Query optimization using CQRS pattern
- Optimized for: PostgreSQL, MySQL, SQLite
Separate Database Support
- Optional separate database for error logs
- Isolate error tables from main app database
- Independent scaling and backup strategies
- Prevent error logging from impacting main app
- Easy configuration via environment variable
Error Management
Resolution Workflow
- Mark as resolved with one click
- Add resolution comments with markdown support
- Link to PRs/commits for context
- Track who resolved each error
- Resolution timestamp for metrics
Batch Operations
- Bulk resolve multiple errors at once
- Bulk delete errors with confirmation
- Checkbox selection UI
- Action toolbar for batch operations
- Confirmation dialogs to prevent accidents
- Plugin events triggered for batch actions
Error Grouping
- Automatic grouping by error type and message
- Custom fingerprint lambda 🆕 — Override grouping logic for specific error types
- Smart de-duplication to reduce noise
- Occurrence counting for grouped errors
- Auto-reopen 🆕 — Resolved errors automatically reopen when they recur (with “Reopened” badge)
- First/last seen timestamps
Error Details Page
- Full backtrace with syntax highlighting and numbered frames
- Request metadata (URL, params, headers)
- User information (if tracked)
- Platform and version details
- Custom context (component, action, etc.)
- Resolution history
- Related errors (coming in Phase 4)
Source Code Integration (NEW!)
⚙️ Optional Feature - Source code integration is disabled by default. Enable it to see source code directly in the dashboard:
config.enable_source_code_integration = true
config.enable_git_blame = true  # Optional: Show git blame info
Features
Inline Source Code Viewer
- View source code directly in the error details page
- Context-aware display showing lines around the error
- Syntax highlighting with proper indentation
- Line numbers matching your editor
- Highlighted error line for quick identification
- No external tools required - works entirely within the dashboard
Git Blame Integration
- Author information for each line of code
- Commit message showing what changed
- Timestamp showing when the code was last modified
- Time ago format for easy understanding
- Works with any Git repository
- Automatic detection of git configuration
Repository Links
- GitHub integration - Direct links to source files on GitHub
- GitLab support - Links to GitLab repositories
- Bitbucket support - Links to Bitbucket repositories
- Automatic detection from git remote configuration
- Branch awareness - Links to the correct branch
- Line number preservation - Opens file at exact error line
Configuration
# Basic setup
config.enable_source_code_integration = true

# Optional: Enable git blame
config.enable_git_blame = true

# Repository settings (auto-detected from git)
config.repository_url = ENV["REPOSITORY_URL"]  # Optional: Override auto-detection
config.repository_branch = ENV["REPOSITORY_BRANCH"] || "main"  # Default branch
How It Works
- Source Code Reader: Reads the actual source file from your filesystem
- Git Blame Parser: Parses
git blameoutput to show commit information - Link Generator: Generates repository links based on your git remote configuration
- Caching: Source code and blame data are cached per request for performance
- Security: Only reads files within your application root directory
Requirements
- Git repository: Your application must be a git repository
- File access: Dashboard must have read access to application source files
- Git installed: For git blame functionality
Benefits
- Faster debugging: See code without switching to your editor
- Context awareness: Understand the code surrounding the error
- Git history: See who last modified the code and why
- Team collaboration: Share error links with full source context
- No external tools: Everything works within your dashboard
Privacy & Security
- Self-hosted: Source code never leaves your infrastructure
- Read-only access: Dashboard only reads files, never modifies
- Path validation: Only files within app root can be accessed
- No external API calls: All processing happens locally
Breadcrumbs — Request Activity Trail (NEW!)
⚙️ Optional Feature - Breadcrumbs are disabled by default. Enable them to see a timeline of events leading up to each error:
config.enable_breadcrumbs = true
config.breadcrumb_buffer_size = 40  # Max events per request (default: 40)
What Are Breadcrumbs?
When an error occurs, you need to know what happened before the crash. Breadcrumbs capture a timeline of events during the request — SQL queries, controller actions, cache operations, background jobs, and mailer deliveries — stored alongside the error for instant debugging context.
Unlike Sentry or Honeybadger (which require SDK configuration), Rails Error Dashboard captures breadcrumbs automatically from ActiveSupport::Notifications — zero configuration beyond the enable flag.
Captured Event Categories
| Category | Events | Example |
|---|---|---|
sql |
sql.active_record |
SELECT * FROM users WHERE id = 42 (2.1ms) |
controller |
process_action.action_controller |
UsersController#show |
cache |
cache_read.active_support, cache_write.active_support |
cache read: users/42 |
job |
perform.active_job |
SendWelcomeEmailJob |
mailer |
deliver.action_mailer |
UserMailer to: [user@example.com] |
deprecation |
deprecation.rails |
Method #foo is deprecated (with caller location) |
custom |
Manual API | checkout started |
Timeline Display
Each error’s detail page shows a Breadcrumbs card with:
- Numbered event list in chronological order
- Color-coded category badges (SQL = blue, Controller = green, Cache = teal, Deprecation = red, etc.)
- Duration highlighting — slow operations (>100ms) shown in red
- Metadata display for custom breadcrumbs
Deprecation Warnings
When breadcrumbs are enabled, Rails deprecation warnings (deprecation.rails) are automatically captured as breadcrumbs. A dedicated red-bordered summary card appears on the error detail page when deprecations are detected, showing:
- The deprecation warning message
- The source caller location (first frame of the callstack)
This helps you identify deprecated code paths that may be contributing to errors — especially useful when upgrading Rails versions.
Deprecation Warnings Aggregate Page
Beyond per-error display, the Deprecations page (/errors/deprecations) provides an app-wide view of all deprecation warnings across errors:
- Summary cards — Unique warnings count, total occurrences, affected errors
- Sortable table — Warning message, source caller, occurrence count, linked error IDs, last seen
- Time range filtering — 7, 30, or 90 day windows
- Pagination — For large result sets
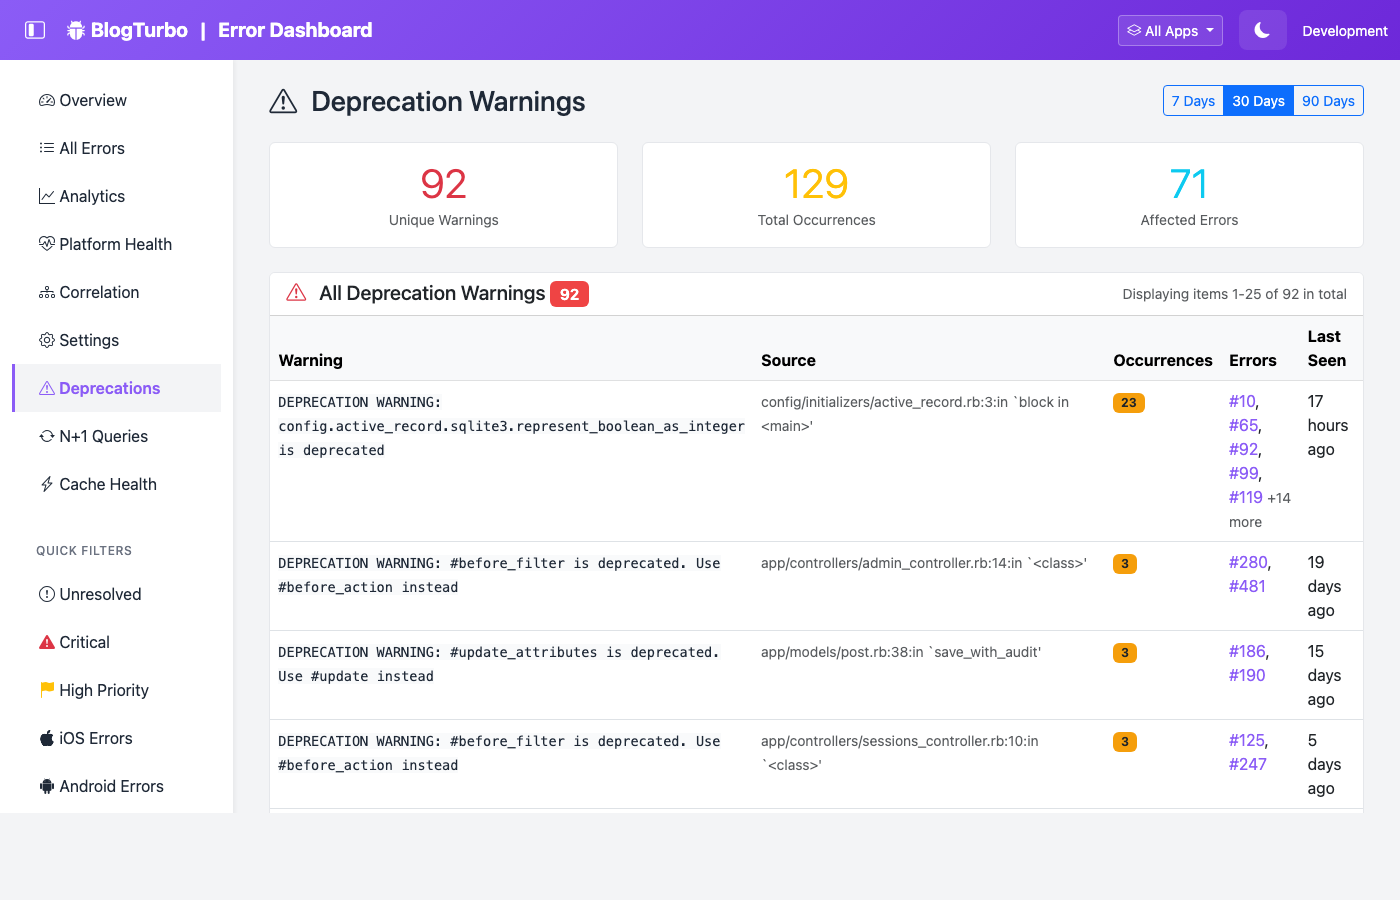
This page helps prioritize which deprecations to fix first based on frequency and scope across your entire error history.
N+1 Query Detection
The N+1 detector analyzes SQL breadcrumbs at display time (not on every request) to identify repeated query patterns that suggest missing eager loading:
- Enabled by default when breadcrumbs are on (
enable_n_plus_one_detection = true) - Flags patterns where the same normalized query appears 3+ times (configurable via
n_plus_one_threshold) - Shows a yellow warning card on the error detail page with repeat count, sample query, and total time
- Normalizes literals (
WHERE id = 42→WHERE id = ?) and IN clauses for fingerprinting - Pure display-time analysis — zero overhead on requests, O(n) over max 40 breadcrumbs
config.enable_n_plus_one_detection = true  # Default: true
config.n_plus_one_threshold = 3            # Min repetitions to flag (default: 3, min: 2)
N+1 Query Patterns Aggregate Page
The N+1 Queries page (/errors/n_plus_one_summary) provides an app-wide view of N+1 patterns across all errors:
- Summary cards — Unique patterns count, total occurrences (sum of all repeats), affected errors
- Pattern table — Sample query (truncated), occurrence count, linked error IDs (first 5 + “N more”), cumulative query time (red if >100ms), last seen
- Time range filtering — 7, 30, or 90 day windows
- Contextual tips — Each per-error N+1 card now shows the extracted table name with an eager loading suggestion
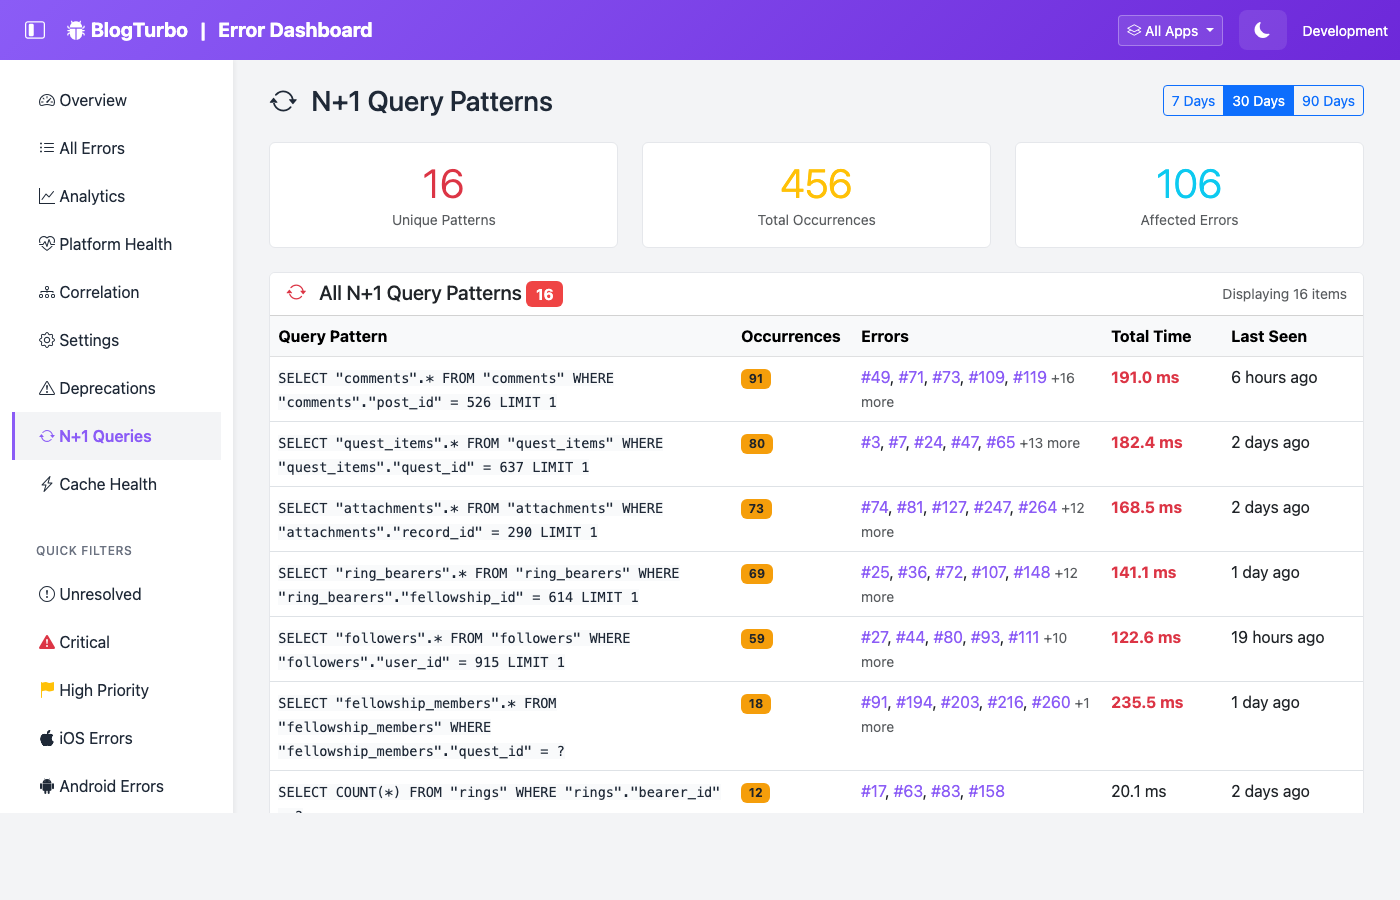
This page helps identify the most impactful N+1 patterns across your entire application.
Cache Health Analysis
Cache breadcrumbs (cache_read.active_support, cache_write.active_support) are analyzed per-error to show cache performance at the moment of failure:
- Per-error card — Reads, writes, hit rate (color-coded), total cache time, slowest operation
- Hit rate advisories — Alerts when hit rate is below 80% with actionable suggestions
- Rails Caching Guide link — Direct link to Rails documentation
Cache Health Aggregate Page
The Cache Health page (/errors/cache_health_summary) provides an app-wide view of cache performance across all errors:
- Summary cards — Errors with cache activity, average hit rate (color-coded: green >=80%, yellow >=50%, red <50%), total cache operations
- Per-error table — Error link, reads, writes, hit rate badge, total time, slowest operation, last seen
- Sorted worst-first — Errors with lowest hit rates appear first (nil rates sorted last)
- Time range filtering — 7, 30, or 90 day windows
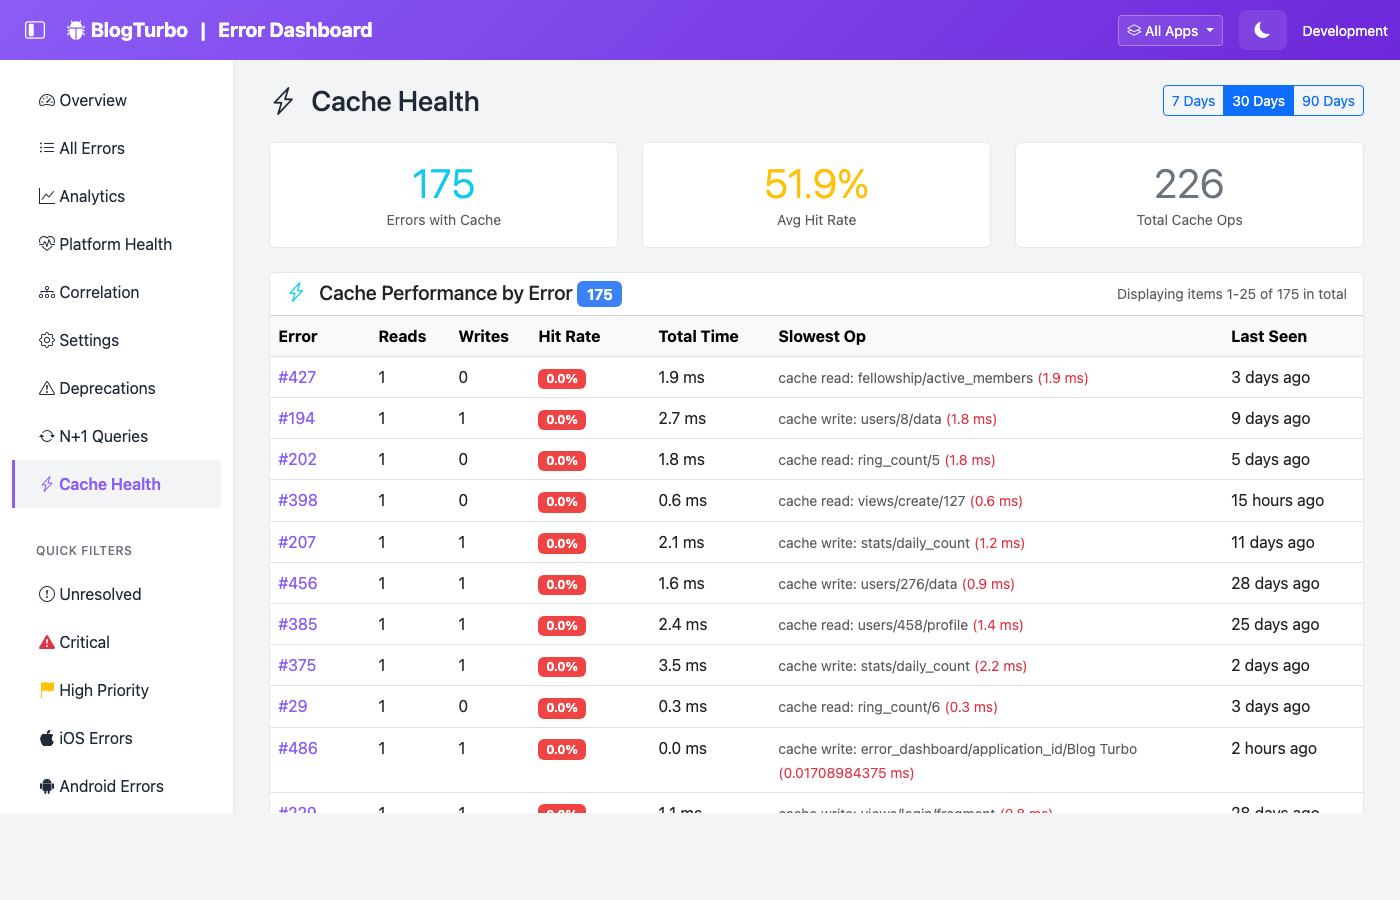
This page helps identify errors associated with poor cache performance across your application.
Manual Breadcrumbs API
Add custom breadcrumbs from anywhere in your application code:
RailsErrorDashboard.add_breadcrumb("checkout started", { cart_id: 123, items: 5 })
RailsErrorDashboard.add_breadcrumb("payment processing", { provider: "stripe" })
Configuration
RailsErrorDashboard.configure do |config|
  config.enable_breadcrumbs = true           # Master switch (default: false)
  config.breadcrumb_buffer_size = 40         # Max events per request (default: 40)
  config.breadcrumb_categories = nil         # nil = all; or [:sql, :controller, :cache, :job, :mailer, :deprecation, :custom]
  config.enable_n_plus_one_detection = true  # Detect N+1 query patterns (default: true)
  config.n_plus_one_threshold = 3            # Min repetitions to flag (default: 3)
end
Safety & Performance
Breadcrumbs are designed with host app safety as the top priority:
- Default OFF — Must opt in, never added silently
- Fixed-size ring buffer — Oldest events dropped when buffer is full (no unbounded memory growth)
- Thread-local storage — No mutex/lock needed; each request has its own buffer
- Cleanup guaranteed — Buffer cleared in
ensureblock (Puma thread reuse safe) - Every subscriber wrapped in
rescue— Never raises, never blocks, never breaks the host app - Message truncation — SQL capped at 200 chars, messages at 500 chars, metadata at 10 keys
- Internal queries filtered — Gem’s own SQL queries excluded to prevent recursion
- Sensitive data filtered — Passwords, tokens, secrets scrubbed via existing
SensitiveDataFilter - Overhead — < 0.1ms per request (events are already fired by Rails)
Async Logging Compatibility
When async logging is enabled, breadcrumbs are harvested from the current thread before the background job is dispatched (since the job runs on a different thread). This ensures breadcrumbs are always captured correctly regardless of logging mode.
System Health Snapshot (NEW!)
⚙️ Optional Feature - System health is disabled by default. Enable it to capture runtime metrics at the moment of every error:
config.enable_system_health = true
What Is System Health?
When debugging errors, you need to know what the app’s runtime state was at the moment of failure. Was memory spiking? Was the connection pool exhausted? Was GC thrashing? System health snapshots answer these questions automatically.
Each error’s detail page shows a System Health card with:
- GC Stats — Heap live/free slots, major GC count, total allocated objects
- Process Memory — RSS in MB (Linux procfs only, returns nil on macOS)
- Thread Count — Number of active threads
- Connection Pool — Size, busy, idle, dead, and waiting connections (with color-coded warnings)
- Puma Stats — Running/max threads, pool capacity, backlog (when Puma is the server)
- RubyVM Cache Health — Constant cache invalidations, class serial, global state from
RubyVM.stat(when available) - YJIT Runtime Stats — Compiled ISEQs, code region size, inline/outlined bytes from
RubyVM::YJIT.runtime_stats(when YJIT is enabled)
Configuration
RailsErrorDashboard.configure do |config|
  config.enable_system_health = true  # Master switch (default: false)
end
Safety Guarantees
System health snapshots are designed with host app safety as the top priority:
- Sub-millisecond — Total snapshot completes in < 1ms
- Every metric individually wrapped in
rescue => nil— one failure doesn’t affect others - Top-level rescue — If everything fails, returns
{ captured_at: ... }(never raises) - No ObjectSpace — Never calls
ObjectSpace.each_objectorObjectSpace.count_objects(heap scan) - No Thread backtraces — Only
Thread.list.count(O(1)), never.map(&:backtrace)(GVL hold) - No subprocess — Process memory uses Linux procfs only, no
ps, no fork, no backtick - No new gems — Uses only Ruby stdlib and ActiveRecord
- No global state — No Thread.current, no mutex, no memoization
Async Logging Compatibility
When async logging is enabled, system health is captured from the current thread before the background job is dispatched (since the job runs on a different thread and may have different runtime state). This ensures the snapshot reflects the actual state at error time.
Job Health Page
The Job Health page (/errors/job_health_summary) provides an aggregate view of background job queue health across all errors:
- Auto-detection — Automatically captures stats from Sidekiq, SolidQueue, or GoodJob at error time
- Per-error table — Error link, adapter badge, failed count (color-coded), queued count, other stats (dead/retry/workers for Sidekiq, claimed/blocked/scheduled for SolidQueue), last seen
- Summary cards — Errors with job data, total failed jobs (red if >0), adapters detected
- Sorted worst-first — Errors with the highest failed job counts appear first
- Time range filtering — 7, 30, or 90 day windows
- Active Job Guide link — Direct link to Rails documentation
This page helps identify errors that coincide with job queue problems — a failing job queue often causes cascading errors.
Database Health Page
The Database Health page (/errors/database_health_summary) is a lightweight PgHero-style database health panel built into the dashboard. It has two sections:
Section A — Live Database Health
Queries PostgreSQL system views at display time (NOT in the capture path):
- Connection pool (all adapters) — Pool size, busy, idle, dead, waiting connections with color-coded warnings
- Table stats (PostgreSQL only) — From
pg_stat_user_tables: table name, estimated rows, size (number_to_human_size), sequential scans, index scans, dead tuples (warning badge if >1000), last vacuum/autovacuum timestamp - Host vs gem tables — Host app tables shown by default, error dashboard tables in a collapsible section
- Unused indexes (PostgreSQL only) — From
pg_stat_user_indexes: indexes with zero scans and non-zero size, with warning badges - Connection activity (PostgreSQL only) — From
pg_stat_activity: connections grouped by state (active, idle, etc.), total count, waiting count - Non-PostgreSQL info banner — SQLite/MySQL users see an info message explaining live stats require PostgreSQL, but connection pool and historical data are still available
The DatabaseHealthInspector service is designed with the same safety principles as SystemHealthSnapshot:
- Every method individually wrapped in
rescue => nil - Top-level rescue returns safe fallback hash (never raises)
- Feature-detects PostgreSQL via
connection.adapter_name - No user input in any SQL query (all static SQL)
Section B — Historical Connection Pool at Error Time
Extracts connection_pool data from the system_health JSON column per-error:
- Summary cards — Errors with pool data, peak utilization (color-coded), total dead connections, total waiting
- Per-error table — Error link, error type, utilization % (progress bar, color-coded: >=80% danger, >=60% warning, else success), busy, idle, dead (red badge if >0), waiting (yellow badge if >0), pool size, last seen
- Sorted by stress score —
(busy + dead + waiting)descending, worst first - Time range filtering — 7, 30, or 90 day windows
- Database Guide link — Direct link to Rails database configuration documentation
- Pagy pagination — Standard paginated table
This page helps identify errors associated with connection pool exhaustion or database performance issues.
Local Variable Capture (v0.4.0)
⚙️ Optional Feature - Local variable capture is disabled by default. Enable it to see the exact values of local variables at the moment an exception was raised:
config.enable_local_variables = true
How It Works
Uses TracePoint(:raise) to capture local variables from the stack frame where the exception originates — before the stack unwinds and the values are lost. This is the most valuable debugging context possible: instead of guessing what went wrong from a stack trace, you see exactly what the variables contained.
Variables are displayed on the error detail page in a dedicated “Local Variables” card with:
- Variable name — The local variable identifier
- Type — The Ruby class of the value (String, Integer, Array, etc.)
- Value — The serialized value (truncated to configured limits)
Configuration
RailsErrorDashboard.configure do |config|
  config.enable_local_variables = true              # Master switch (default: false)
  config.local_variable_max_count = 15              # Max variables per exception (default: 15)
  config.local_variable_max_depth = 3               # Max object nesting depth (default: 3)
  config.local_variable_max_string_length = 200     # Truncate strings beyond this (default: 200)
  config.local_variable_max_array_items = 10        # Max array items to serialize (default: 10)
  config.local_variable_max_hash_items = 20         # Max hash entries to serialize (default: 20)
  config.local_variable_filter_patterns = []        # Additional sensitive name patterns (default: [])
end
Safety & Privacy
- Never stores Binding objects — Values are extracted immediately from the TracePoint, then the Binding is discarded for GC
- Sensitive data filtered — Rails
filter_parameterspatterns are applied automatically (passwords, tokens, PII). Additional patterns can be added vialocal_variable_filter_patterns - Configurable limits — All size limits are enforced during serialization to prevent memory bloat
- Opt-in only — Disabled by default, must be explicitly enabled
Instance Variable Capture (v0.4.0)
⚙️ Optional Feature - Instance variable capture is disabled by default. Enable it to see the instance variables of the object that raised the exception:
config.enable_instance_variables = true
How It Works
Uses TracePoint(:raise) to inspect tp.self (the receiver object at the raise point) and capture its instance variables. This shows the internal state of the object that failed — for example, the @user, @order, or @connection that was in a bad state when the exception occurred.
The error detail page shows an “Instance Variables” card alongside the local variables with:
- Variable name — The instance variable identifier (e.g.,
@user) - Type — The Ruby class of the value
- Value — The serialized value
_self_class— Special metadata showing the receiver’s class name
Configuration
RailsErrorDashboard.configure do |config|
  config.enable_instance_variables = true             # Master switch (default: false)
  config.instance_variable_max_count = 20             # Max variables per exception (default: 20)
  config.instance_variable_filter_patterns = []       # Additional sensitive name patterns (default: [])
end
Safety
- Same safety guarantees as local variable capture: no Binding storage, sensitive data filtering, configurable limits
- Shares the same TracePoint handler as local variable capture — minimal overhead when both are enabled
Swallowed Exception Detection (v0.4.0)
⚙️ Optional Feature - Swallowed exception detection is disabled by default. Requires Ruby 3.3+ (TracePoint :rescue event). Enable it to detect exceptions that are raised but silently rescued:
config.detect_swallowed_exceptions = true
How It Works
Uses two TracePoint events working together:
- TracePoint(
:raise) — Tracks every exception raise with its location - TracePoint(
:rescue) — Tracks every rescue with its location (Ruby 3.3+ only, Feature #19572)
By comparing raise counts vs rescue counts per location, the system identifies code paths where exceptions are caught but never logged, re-raised, or handled meaningfully. These “swallowed” exceptions are the hardest bugs to find — they silently corrupt state without any visible error.
Dashboard Page
The dedicated page at /errors/swallowed_exceptions shows:
- Summary cards — Total swallowed patterns, total rescues, total raises
- Pattern table — Exception class, raise location, rescue location, raise count, rescue count, ratio (color-coded), last seen
- Time range filtering — 7, 30, or 90 day windows
Configuration
RailsErrorDashboard.configure do |config|
  config.detect_swallowed_exceptions = true           # Master switch (default: false)
  config.swallowed_exception_max_cache_size = 1000    # Max entries per thread-local cache (default: 1000)
  config.swallowed_exception_flush_interval = 60      # Seconds between DB flushes (default: 60)
  config.swallowed_exception_threshold = 0.95         # Rescue ratio to flag as swallowed (default: 0.95)
  config.swallowed_exception_ignore_classes = []      # Exception classes to skip (default: [])
end
Safety & Performance
- Memory-bounded — Thread-local caches with configurable max size, background flush to database
- Hourly bucketing — Aggregated counts per hour, not per-event
- Auto-disabled on Ruby < 3.3 — Logs a warning and disables gracefully (no crash)
- Minimal overhead — TracePoint
:rescueis lightweight (same cost as:raisewhich Sentry ships)
On-Demand Diagnostic Dump (v0.4.0)
⚙️ Optional Feature - Diagnostic dumps are disabled by default. Enable to snapshot your app’s entire system state on demand:
config.enable_diagnostic_dump = true
How It Works
Captures a comprehensive snapshot of your application’s runtime state — useful for debugging intermittent production issues without reproducing them. The dump includes:
- Environment — Ruby version, Rails version, server (Puma/etc.)
- GC Stats — Full
GC.statoutput - Thread Info — Thread count and statuses
- Connection Pool — Pool size, busy, idle, dead, waiting
- Memory — Process RSS (Linux)
- Job Queue Health — Adapter stats (Sidekiq/SolidQueue/GoodJob)
- RubyVM Stats — Cache health, YJIT stats (when available)
Triggering a Dump
Two ways to capture a dump:
- Dashboard button — Click “Capture Dump” on the
/errors/diagnostic_dumpspage - Rake task —
rails error_dashboard:diagnostic_dump(optionally withNOTE="deploy check")
Dashboard Page
The page at /errors/diagnostic_dumps shows:
- Summary cards — Total dumps, threads (latest), memory (latest)
- Dump history — PID, uptime, environment, system health summary, GC summary, job queue, expandable details
- Paginated — Standard Pagy pagination
Rack Attack Event Tracking (v0.4.0)
⚙️ Optional Feature - Rack Attack tracking is disabled by default. Requires breadcrumbs to be enabled. Enable it to track Rack::Attack security events:
config.enable_breadcrumbs = true
config.enable_rack_attack_tracking = true
How It Works
Subscribes to Rack::Attack’s ActiveSupport::Notifications events and records them as breadcrumbs. When an error occurs after a throttle or blocklist event, the breadcrumbs show the security context — revealing whether rate limiting or blocking contributed to the error.
Tracked Events
- Throttle events — Request rate exceeded configured limits
- Blocklist events — Request matched a blocklist rule
- Track events — Custom tracking rules fired
Dashboard Page
The page at /errors/rack_attack_summary shows event breakdown with time range filtering (7, 30, or 90 days).
Safety
- Auto-disabled — If breadcrumbs are not enabled, Rack Attack tracking is automatically disabled with a warning (no crash)
- Zero integration cost — Rack::Attack already emits AS::Notifications events; this just subscribes to them
Process Crash Capture (v0.4.0)
⚙️ Optional Feature - Process crash capture is disabled by default. Enable it to capture unhandled exceptions that crash the Ruby process:
config.enable_crash_capture = true
How It Works
Registers an at_exit hook that fires when the Ruby process exits. If the exit is caused by an unhandled exception ($! is set), the crash data is written to a JSON file on disk — because the database may be unavailable during process shutdown.
On the next boot, the gem automatically imports any crash files and creates error log records with platform: "crash_capture" and severity: "fatal".
What Gets Captured
- Exception details — Class, message, backtrace
- Cause chain — Full exception cause chain
- Runtime context — Ruby version, Rails version, PID, uptime
- GC stats — Garbage collector state at crash time
- Thread count — Number of active threads
Configuration
RailsErrorDashboard.configure do |config|
  config.enable_crash_capture = true      # Master switch (default: false)
  config.crash_capture_path = nil         # Custom path for crash files (default: Dir.tmpdir)
end
Why This Matters
This is a self-hosted only feature — impossible for SaaS error trackers. When a process crashes, SaaS tools lose the connection before they can report. Since this gem runs inside the process, it can write to disk as the last act before exit.
Plugin System
Architecture
- Event-driven extensibility
- Safe execution - plugin errors don’t break the app
- Easy to create - Simple Ruby class interface
- Lifecycle hooks throughout error handling
Available Events
before_error_logged- Before error is savedafter_error_logged- After error is savedbefore_error_resolved- Before marking resolvedafter_error_resolved- After marking resolvedbefore_batch_resolve- Before bulk resolveafter_batch_resolve- After bulk resolvebefore_batch_delete- Before bulk deleteafter_batch_delete- After bulk delete
Built-in Plugins (Examples)
Metrics Plugin
- Send error metrics to StatsD, Datadog, Prometheus
- Track error counts, rates, severities
- Custom metric namespaces
Audit Log Plugin
- Log all error management actions
- Track who resolved/deleted what and when
- Compliance and accountability
Jira Integration Plugin
- Auto-create Jira tickets for critical errors
- Link errors to existing tickets
- Update tickets on resolution
- Configurable project and issue type
Custom Plugins
- Simple interface: inherit from
RailsErrorDashboard::Plugin - Register easily:
RailsErrorDashboard.register_plugin(YourPlugin.new) - Access full error object in hooks
- Extend functionality without modifying core code
Security & Privacy
Authentication
- HTTP Basic Auth built-in (default)
- Custom authentication via
config.authenticate_withlambda — use Devise, Warden, session-based, or any auth system - Configurable credentials via environment variables
- Fail-closed security — lambda errors are rescued, logged, and result in 403 Forbidden
Data Privacy
- Self-hosted - all data stays on your infrastructure
- Sensitive data filtering 🆕 — Passwords, tokens, secrets, API keys auto-filtered before storage
- Configurable filter patterns 🆕 — Add custom patterns via
config.sensitive_data_patterns - No external API calls (except notifications you configure)
- No telemetry or tracking
- Full control over who sees error data
Separate Database Isolation
- Option to use separate database for error logs
- Isolate sensitive error data from main app database
- Different access controls and backup policies
🏗️ Architecture & Code Quality
Design Patterns
- Service Objects for business logic
- CQRS (Command Query Responsibility Segregation)
- Commands: LogError, ResolveError, BatchOperations
- Queries: ErrorsList, DashboardStats, AnalyticsStats
- Value Objects for immutable data (ErrorContext)
- Repository pattern via Query Objects
Code Quality
- 2,600+ RSpec tests with high coverage
- Multi-version testing (Rails 7.0, 7.1, 7.2, 8.0, 8.1)
- Ruby 3.2, 3.3, 3.4, 4.0 support
- CI/CD via GitHub Actions
- RuboCop linting
- Clean, maintainable code you can understand and modify
Extensibility
- Plugin system for custom integrations
- Event hooks throughout lifecycle
- Configuration API for customization
- Open source - fork and modify as needed
🛠️ Developer Experience
Easy Installation
- 5-minute setup with generator
- Automatic migrations
- Automatic route mounting
- Works immediately after installation
Configuration
- Simple initializer with sensible defaults
- Environment variable support out of the box
- Documented options with inline comments
- Override anything you need
Documentation
- Comprehensive guides for every feature
- API reference with examples
- Mobile integration guides (React Native, Flutter)
- Plugin development guide
- Troubleshooting guides
Testing Support
- Multi-version testing with Appraisal
- Factory Bot integration for test data
- RSpec matchers for common assertions
- Test helpers for error generation
- RSpec request spec generator —
rails generate rails_error_dashboard:rspec_request_specsgenerates request specs for all dashboard endpoints
Production Ready
Performance
- Handles high volume with async logging and sampling
- Database optimized with proper indexes
- Memory efficient with pagination and limiting
- Fast queries using CQRS pattern
Reliability
- Safe error handling - errors in error logging don’t crash app
- Plugin safety - plugin errors logged but don’t break dashboard
- Retry logic for failed notifications
- Graceful degradation when services unavailable
Monitoring
- ActiveSupport::Notifications integration
- Plugin events for external monitoring
- Metrics export via plugins
- Logs all actions for debugging
Advanced Analytics Features
⚙️ Optional Features - All advanced analytics are disabled by default. Enable the ones you need:
config.enable_similar_errors = true          # Fuzzy error matching
config.enable_co_occurring_errors = true     # Co-occurring patterns
config.enable_error_cascades = true          # Cascade detection
config.enable_baseline_alerts = true         # Baseline anomaly alerts
config.enable_occurrence_patterns = true     # Cyclical/burst patterns
config.enable_error_correlation = true       # Version/user correlation
config.enable_platform_comparison = true     # Platform health comparison
config.enable_source_code_integration = true # Source code viewer (NEW!)
config.enable_git_blame = true               # Git blame integration (NEW!)
All code is complete and tested (2,600+ tests passing). These advanced features provide powerful insights for production debugging.
Fuzzy Error Matching
- Find similar errors even with different error hashes
- Similarity scoring (0.0 - 1.0)
- Backtrace pattern matching using signatures
- Levenshtein distance on error messages
- Configurable similarity threshold (default: 0.6)
Co-occurring Error Patterns
- Detect errors that happen together in time
- Configurable time window (default: 5 minutes)
- Frequency analysis for related errors
- Help identify cascading failures
Error Cascade Detection
- Identify parent → child error chains
- Detect when one error causes another
- Average delay calculation between related errors
- Cascade probability scoring
- Background analysis job (runs hourly)
Baseline Monitoring & Anomaly Detection
- Statistical baseline calculation (hourly, daily, weekly)
- Mean, standard deviation, percentiles (95th, 99th)
- Outlier removal (> 3 std devs)
- Anomaly severity levels:
- Elevated (2-3 std devs)
- High (3-4 std devs)
- Critical (4+ std devs)
- Historical baseline tracking
Automated Baseline Alerts
- Proactive notifications when baselines exceeded
- Configurable thresholds (default: 2 std devs)
- Alert cooldown to prevent spam (default: 120 minutes)
- Severity filtering (only alert on critical/high)
- Integration with notification system
Enhanced Occurrence Patterns
- Cyclical pattern detection (daily/weekly rhythms)
- Business hours vs night patterns
- Weekend patterns
- Burst detection (many errors in short time)
- Pattern strength scoring
- Hourly heatmap visualization
Error Correlation Analysis
- Version correlation - which releases have more errors
- User correlation - users affected by multiple error types
- Time-based correlation - errors at same time of day
- Release quality tracking
- Problematic version identification
Platform-Specific Baselines
- Separate baselines per platform (iOS, Android, Web, API)
- Platform health comparison
- Cross-platform correlation
- Platform stability scores
v0.2 Quick Wins (NEW!)
All v0.2 features are production-safe and designed around the core principle: never break the host app.
Exception Cause Chain
When exceptions wrap other exceptions (common with network errors, database failures, etc.), the full cause chain is captured:
RuntimeError: Failed to load user profile
  └── caused by: SocketError: Connection refused
        └── caused by: Errno::ECONNREFUSED: Connection refused - connect(2) for 127.0.0.1:6379
Stored as structured JSON in the exception_cause column. Displayed on the error detail page with a collapsible cause chain viewer. No configuration needed.
Custom Fingerprint Lambda
Override the default error grouping with a lambda:
config.custom_fingerprint = ->(exception, context) {
  case exception
  when ActiveRecord::RecordNotFound
    "record-not-found-#{context[:controller]}"
  when ActionController::RoutingError
    "routing-error"  # Group all 404s together
  else
    nil  # Fall back to default fingerprinting
  end
}
CurrentAttributes Integration
Automatically captures all values from your ActiveSupport::CurrentAttributes subclasses:
# Your app defines:
class Current < ActiveSupport::CurrentAttributes
  attribute :user, :account, :request_id
end

# We auto-capture: { user: ..., account: ..., request_id: ... }
# Zero configuration needed
Enriched HTTP Context
Every error from an HTTP request automatically captures:
| Field | Example | Description |
|---|---|---|
http_method |
GET |
Request method |
hostname |
api.myapp.com |
Server hostname |
content_type |
application/json |
Request content type |
request_duration_ms |
342 |
Time elapsed before error |
Environment Info
Captured once at error time, so you can see exactly what was running:
{
  "ruby_version": "3.3.0",
  "rails_version": "8.1.1",
  "gem_versions": { "puma": "6.4.0", "sidekiq": "7.2.0" },
  "server": "Puma",
  "database_adapter": "postgresql"
}
Sensitive Data Filtering
Automatically scrubs sensitive data from error context before storage:
# Enabled by default. Configure patterns:
config.filter_sensitive_data = true
config.sensitive_data_patterns = [
  /password/i, /token/i, /secret/i, /api_key/i,
  /authorization/i, /credit_card/i, /ssn/i
]
Values matching these patterns are replaced with [FILTERED].
Auto-Reopen on Recurrence
When a resolved error occurs again, it automatically:
- Sets
resolved = falseandstatus = "new" - Records
reopened_attimestamp - Increments
occurrence_count - Shows a “Reopened” badge in the dashboard
Notification Throttling
Three layers to prevent alert fatigue:
- Severity filter — Only notify for errors above a minimum severity
- Per-error cooldown — Don’t re-notify for the same error within N minutes
- Threshold alerts — Notify at milestone occurrence counts (10, 50, 100, 500, 1000)
BRIN Indexes
PostgreSQL BRIN index on occurred_at for time-series performance:
- 72KB index vs 676MB B-tree equivalent
- Functional index on
DATE(occurred_at)for 70x faster dashboard queries - Automatic retention cleanup job for old errors
Structured Backtrace
Uses backtrace_locations (Ruby 2.0+) when available for richer data:
- Proper
path,lineno, andlabelfields - Falls back gracefully to string parsing
Reduced Dependencies
Core gem requires 4 runtime gems: rails, pagy, groupdate, and concurrent-ruby. Four previously-required dependencies are now optional:
browser— for User-Agent platform detectionchartkick— for chart helpers (falls back to CDN-only JS)httparty— for webhook/notification HTTP calls (falls back to Net::HTTP)turbo-rails— for real-time Turbo Stream updates (falls back to page refresh)
Metrics & Reporting
Dashboard Metrics
- Today’s errors count with trend
- This week’s errors with comparison
- Unresolved errors count
- Resolved errors count
- Resolution rate percentage
Analytics Page
- Error trends over time (line charts)
- Error count by severity (donut charts)
- Top error types (bar charts)
- Platform breakdown (pie charts)
- Error rate calculations
Developer Insights
- Priority scoring for triage
- User impact percentage
- Platform stability scores
- Resolution time averages
- Error velocity (increasing/decreasing)
🎉 That’s every feature! Rails Error Dashboard is a comprehensive, production-ready error tracking solution built specifically for Rails developers who value ownership and privacy.
🔧 How to Enable/Disable Features
During Installation
When you run the installer, you’ll be prompted to select which optional features to enable:
rails generate rails_error_dashboard:install
Interactive Mode (default):
━━━━━━━━━━━━━━━━━━━━━━━━━━━━━━━━━━━━━━━━━━━━━━━━━━━━━━━━━━━━━━━━━━
  Rails Error Dashboard - Installation
━━━━━━━━━━━━━━━━━━━━━━━━━━━━━━━━━━━━━━━━━━━━━━━━━━━━━━━━━━━━━━━━━━

[1/23] Slack Notifications
    Send errors to Slack channels instantly
    Enable? (y/N): y
    ✓ Enabled

[2/23] Email Notifications
    Email error alerts to your team
    Enable? (y/N): n
    ✗ Disabled

... (continues for all features)
Non-Interactive Mode (for automation/CI):
rails generate rails_error_dashboard:install \
  --no-interactive \
  --slack \
  --async_logging \
  --baseline_alerts \
  --platform_comparison
Available CLI Flags:
--slack- Enable Slack notifications--email- Enable email notifications--discord- Enable Discord notifications--pagerduty- Enable PagerDuty notifications--webhooks- Enable webhook notifications--async_logging- Enable async error logging--error_sampling- Enable error sampling--separate_database- Use separate database--baseline_alerts- Enable baseline anomaly alerts--similar_errors- Enable fuzzy error matching--co_occurring_errors- Enable co-occurring error detection--error_cascades- Enable error cascade detection--error_correlation- Enable error correlation analysis--platform_comparison- Enable platform comparison--occurrence_patterns- Enable occurrence pattern detection--source_code_integration- Enable source code viewer--git_blame- Enable git blame integration--breadcrumbs- Enable breadcrumbs (request activity trail)--system_health- Enable system health snapshot--local_variables- Enable local variable capture via TracePoint--instance_variables- Enable instance variable capture via TracePoint--detect_swallowed_exceptions- Enable swallowed exception detection (Ruby 3.3+)--diagnostic_dump- Enable on-demand diagnostic dump--rack_attack_tracking- Enable Rack Attack event tracking (requires breadcrumbs)--crash_capture- Enable process crash capture via at_exit hook
After Installation
All features can be enabled or disabled at any time by editing your initializer:
Location: config/initializers/rails_error_dashboard.rb
To Enable a Feature
- Open the initializer file
- Find the feature section (use Cmd/Ctrl+F to search)
- Uncomment the configuration lines if needed
- Set
config.enable_[feature_name] = true - Add any required settings (webhook URLs, etc.)
- Restart your Rails server
Example - Enabling Slack notifications:
# Before:
# config.enable_slack_notifications = false
# config.slack_webhook_url = ENV["SLACK_WEBHOOK_URL"]

# After:
config.enable_slack_notifications = true
config.slack_webhook_url = ENV["SLACK_WEBHOOK_URL"]
config.dashboard_base_url = ENV["DASHBOARD_BASE_URL"]  # For clickable links
Example - Enabling baseline alerts:
# Before:
# config.enable_baseline_alerts = false

# After:
config.enable_baseline_alerts = true

# Optional tuning:
config.baseline_alert_threshold_std_devs = 2.0  # Sensitivity (default: 2.0)
config.baseline_alert_severities = [:critical, :high]  # Which severities to alert on
config.baseline_alert_cooldown_minutes = 120  # Minutes between alerts
To Disable a Feature
- Open the initializer file
- Find the feature section
- Set
config.enable_[feature_name] = false - Or comment out the entire section
- Restart your Rails server
Example - Disabling email notifications:
# Before:
config.enable_email_notifications = true
config.notification_email_recipients = ENV.fetch("ERROR_NOTIFICATION_EMAILS", "").split(",")

# After:
config.enable_email_notifications = false
# config.notification_email_recipients = ENV.fetch("ERROR_NOTIFICATION_EMAILS", "").split(",")
Restart Required
After changing any configuration, you must restart your Rails server:
# Development
rails server

# Production
systemctl restart myapp
# or
touch tmp/restart.txt  # For Passenger
Feature Combinations
You can enable/disable any combination of features. Here are some recommended configurations:
Minimal Setup (Small Apps)
config.enable_slack_notifications = true  # Just one notification channel
# Everything else disabled
Production SaaS
# Notifications
config.enable_slack_notifications = true
config.enable_pagerduty_notifications = true

# Performance
config.async_logging = true

# Analytics
config.enable_baseline_alerts = true
config.enable_platform_comparison = true
config.enable_error_correlation = true

# Debugging
config.enable_breadcrumbs = true
config.enable_system_health = true
Enterprise/High-Scale
# All notifications
config.enable_slack_notifications = true
config.enable_email_notifications = true
config.enable_pagerduty_notifications = true

# All performance features
config.async_logging = true
config.sampling_rate = 0.1  # Sample 10% of non-critical errors
config.use_separate_database = true

# All advanced analytics
config.enable_baseline_alerts = true
config.enable_similar_errors = true
config.enable_co_occurring_errors = true
config.enable_error_cascades = true
config.enable_error_correlation = true
config.enable_platform_comparison = true
config.enable_occurrence_patterns = true

# Developer tools
config.enable_source_code_integration = true
config.enable_breadcrumbs = true
config.enable_system_health = true
Environment-Specific Configuration
You can enable different features per environment:
RailsErrorDashboard.configure do |config|
  # Core settings (all environments)
  config.dashboard_username = ENV.fetch("ERROR_DASHBOARD_USER", "gandalf")
  config.dashboard_password = ENV.fetch("ERROR_DASHBOARD_PASSWORD", "youshallnotpass")

  # Production-only features
  if Rails.env.production?
    config.enable_slack_notifications = true
    config.enable_pagerduty_notifications = true
    config.async_logging = true
    config.enable_baseline_alerts = true
  end

  # Development-only features
  if Rails.env.development?
    # Note: Authentication is always required and cannot be disabled
    config.sampling_rate = 0.5  # Reduce noise in development
  end

  # Staging-specific
  if Rails.env.staging?
    config.enable_slack_notifications = true  # Notify #staging-errors channel
    config.enable_baseline_alerts = true  # Test alert logic
  end
end
Checking Enabled Features
To see which features are currently enabled, you can check in the Rails console:
# Rails console
config = RailsErrorDashboard.configuration

# Check specific features
config.enable_slack_notifications  # => true or false
config.enable_baseline_alerts      # => true or false

# List all advanced analytics features
{
  similar_errors: config.enable_similar_errors,
  co_occurring: config.enable_co_occurring_errors,
  cascades: config.enable_error_cascades,
  baselines: config.enable_baseline_alerts,
  correlation: config.enable_error_correlation,
  platform_comparison: config.enable_platform_comparison,
  patterns: config.enable_occurrence_patterns
}

# v0.2 features
{
  filter_sensitive_data: config.filter_sensitive_data,
  custom_fingerprint: config.custom_fingerprint.present?,
  notification_minimum_severity: config.notification_minimum_severity,
  notification_cooldown_minutes: config.notification_cooldown_minutes,
  notification_threshold_alerts: config.notification_threshold_alerts
}
Feature Documentation
For detailed information about what each feature does and when to use it, see the relevant sections above:
- Notifications: 🚨 Notifications & Alerting
- Performance: ⚡ Performance & Scalability
- Advanced Analytics: 🎯 Advanced Analytics Features